Sabermetric Networks
Traditional baseball stats are agnostic to game impact. They count what happened but not when, against whom, or whether it actually moved the team toward a win.
This project models the 2023 MLB season as a bipartite network: pitchers on one side, batters on the other, with an edge for every plate appearance that produced an outcome. Each matchup carries two separate weights, Run Expectancy (runs added or saved given the base-out state, scoped to the inning) and Win Probability Added (how much the play shifted the team's odds of winning, scoped to the full game). The two get split into two distinct graphs, each with edges pointing toward whichever player came out ahead on that metric. If a pitcher and batter meet twenty times in the season, there are twenty edges between them in each graph, one per matchup.
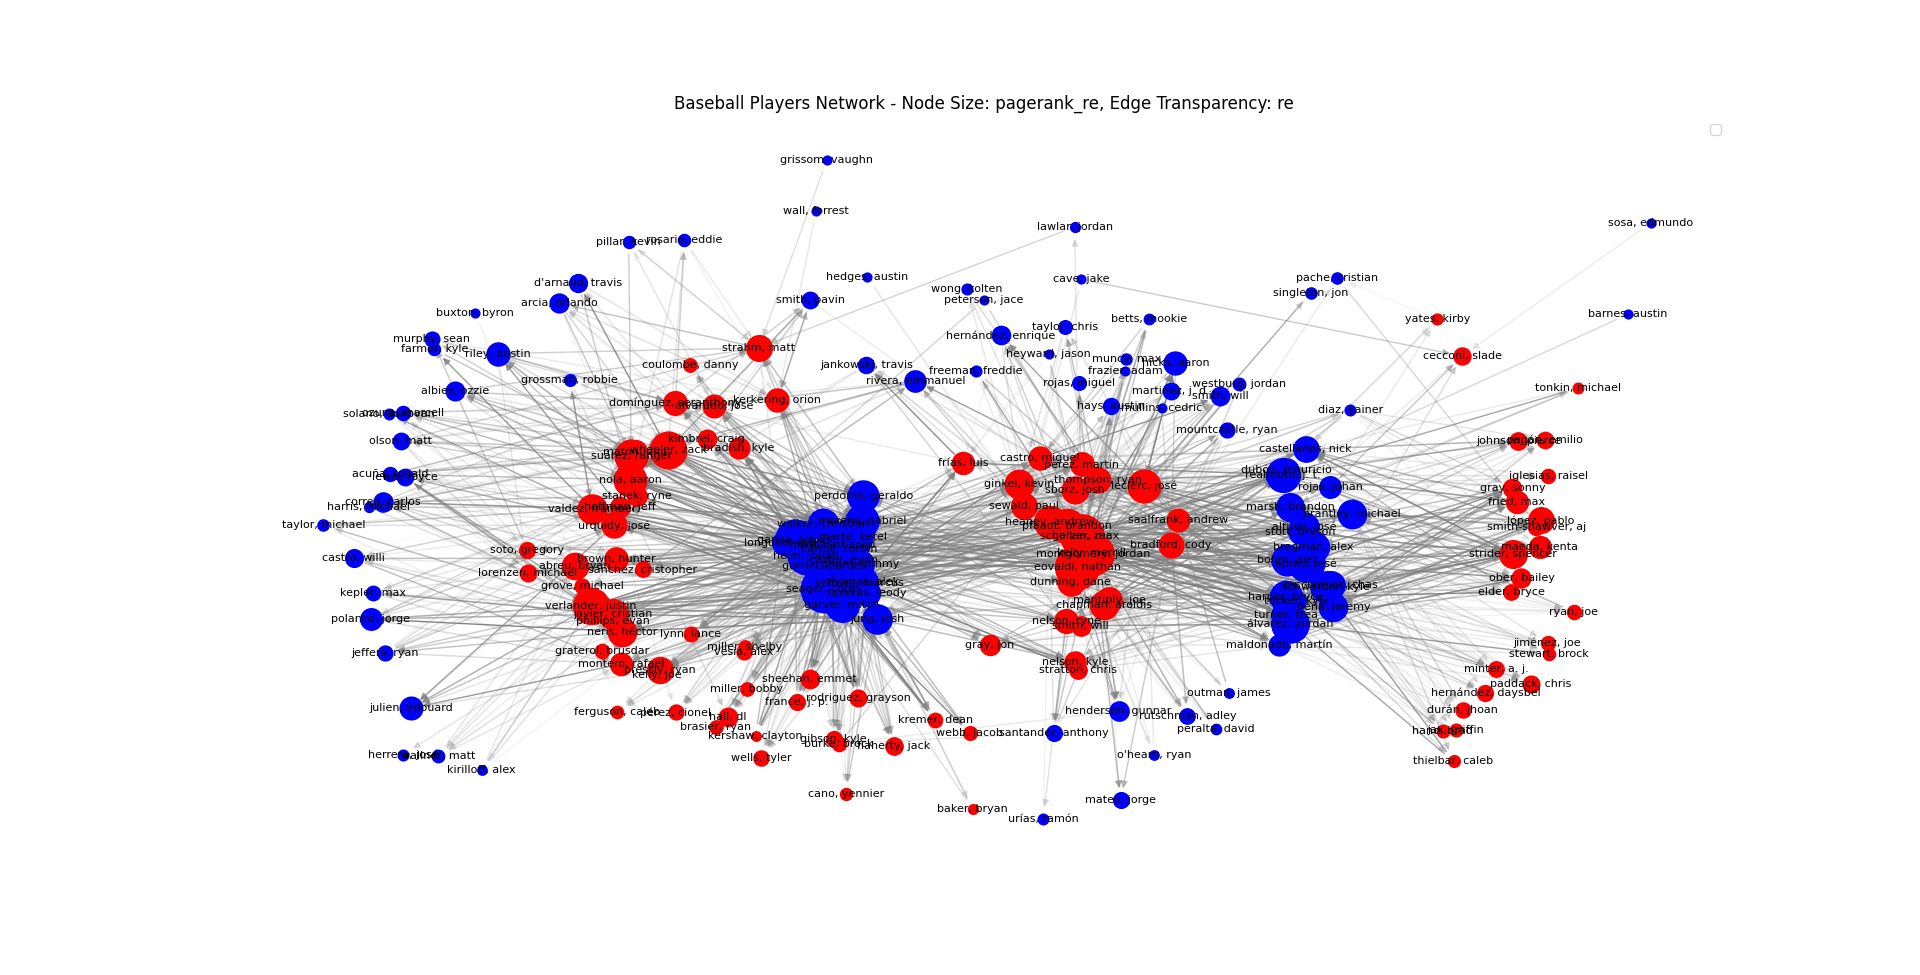
The RE graph and the WPA graph encode different things. RE traces the flow of run generation: who produced runs, against whom, at the inning level. It is a matchup indicator. WPA traces the flow of win generation: who tilted games in moments that mattered, with leverage baked in. It is a leverage indicator. The same player can look very different in the two views, and the gap between them is part of the signal.
Reading a node, a strong batter is one with heavy incoming weight spread across many distinct pitchers, not just thick edges with two or three. A strong pitcher is the inverse. Repeat matchups thicken individual pair edges, and consistent dominance surfaces clusters: pitchers a batter reliably beats, batters who have a specific pitcher's number. Teams emerge as aggregations of these substructures.
This isn't trying to be the metric. Fielding, baserunning, sequencing, all of it sits outside the graph. The network is one lens, focused on who actually produced against the people they faced.
A BiRank variant, PageRank adapted for bipartite graphs, then ranks players within this structure. The bipartite handling matters because the two sides aren't symmetric: even the league's worst pitcher, on average, has a higher expected outcome than the league's best hitter. What you get out is each metric recursively reweighted by strength of opposition: production against weaker players counts less, production against stronger players counts more. Run on the RE graph it produces a run-impact ranking that already accounts for who you faced; run on the WPA graph it does the same for wins, with leverage carried through from the weights.